In a webinar on June 4, President Pascal Charriau and Head of Market Research Morgan Crenes presented the Global Energy Report 2019, which is available on the company's website.
Chart 0
Some of the results seem remarkable.
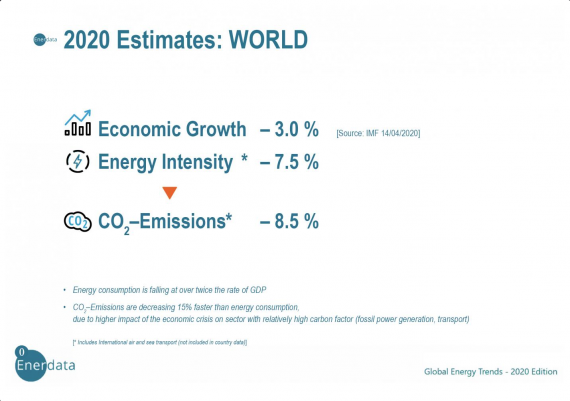
That the Covid-19 crisis has caused a sharp downturn in global economic development - and thus also triggered a sharp drop in energy statistics - a no-brainer. However, with the current very dramatic figures on the development of exports and consumer demand in general, it is worth asking: how sharp is the decline really?
Minus 8.5%! It really is a massive slump; and yet ... perhaps less than hoped for! Certainly, at the beginning of June the end of the year is still far off. Major economic stimulus packages are on the way, but whether they will take effect immediately or not until next year is not yet clear. Add to this the developments in the USA, the conflict with China, a possible second wave: altogether it is rather unlikely that the declines in GDP and environmental indicators will be less substantial.
I'm torn between what I want and what I don't want!
What is striking is that the decline in global CO2 emissions is almost twice as high as the (predicted) decline in GDP.
The presentation initially focused on the past year 2019 - which, incidentally, on 45 charts also deals with numerous specific developments in the energy market. I will only pick out a few of the overarching statements.
Chart 1
The first chart, which documents changes in 2018/2019, makes it clear that developments in the energy sector are very uneven globally. In summary, energy consumption was at a new record high, but nevertheless only 0.7% higher than in the previous year; a rather moderate increase, which must still be worrying in view of climate change. In the regional overview and the national figures we see that even "under normal conditions" the decline in energy consumption can be observed worldwide, with exceptions: Brazil, Australia, Canada.
Chart 2
This decline is even more evident in terms of energy intensity, which represents a ratio of consumption to GDP. In the long-term view (right part of the chart), the decline in this parameter is around two percent (dark green line).
However, even more than this drifting apart of cause and effect, as we saw in the introductory statement on GDP and CO2 emissions, I was struck by the core statement of this presentation, which is represented by the light green line. Pascal Charriau called it almost incidentally: "We need half a corona crisis every year to achieve the 2 degree target of the Paris Treaty". In other words, business as usual will not be enough to achieve the objectives of the Paris Treaty, and we are no longer talking about the 1.5 degree objective.
Chart 3
It's not all gloom and doom. At least one development could give us some courage. Chart 3 shows that - with a significant decline in total energy production (dark green bars) in the first five months of 2020, the use of renewable energies (orange bars) has virtually exploded.
Chart 4
Electricity generation and transport are responsible for around 60% of the reductions in emissions. The circles in the lower part of the chart show that the weights vary greatly from region to region. The bar chart above shows how the share of CO2-free power generation in the power mix has developed. The very high share of CO2-free energy in France is - of course - primarily due to the predominance of nuclear energy here; however, here, as in Germany and the USA, the share of nuclear energy has declined overall following power plant shutdowns, while at the same time the share of renewable energies has grown "everywhere".
Chart 5
The forecasts in this chart are initially based on the assumption that the slumps and sharp declines do not in themselves represent sustainable development. If there is an economic recovery, and despite all my ecological commitment I find it difficult to wish for anything else, the "nice losses" will quickly be lost again. The various curves refer to different scenarios, with the dark green forecasts referring to "before the crisis" and the orange ones to "after the crisis".
It becomes very clear that the underlying conditions of the recovery will have a really massive impact on the overall ecological development.
Chart 6
summarizes these statements.
